Predicting Restaurant Franchise Placement
David Edwards
May 11, 2020
1. Introduction
1.1 Background
Running an up-and-coming restaurant franchise comes with many different problems. One of the primary issues involves finding new locations to find potential franchisees. Because a potential franchisee can bring in significant revenue to the franchise, it’s important to ensure that the new franchise locations are successful, and a significant measure of that success hinges on location. Much like you may not choose to put a McDonald’s next door to another McDonalds, you also wouldn’t put a college-themed restaurant in a town with no college presence. So, how can a franchise choose where to look for new franchisees?
1.2 Problem
There is no one location that works for all restaurants. It’s necessary to look into several different aspects of a surrounding neighborhood in order to determine likely locations. In this case, I’m looking into one particular franchise, a local cannabis-themed sandwich restaurant/bar. Their name is withheld as this report was done without their knowledge.
1.3 Interest
Both the corporate franchise and any potential franchisees would be interested in these results. The franchise could use these results to buy advertising targeting potential franchisees. In addition, investors looking to invest in franchises could look at this information to determine where they may wish to invest.
2. Data Acquisition and Cleaning
2.1 Data Sources
The one common denominator for all of this franchise’s successful restaurants is proximity to a college or university. College and University data can be found on open.data.gov. Another potential impact on location would be the proximity of a large number of sandwich locations with bars. This information was found using the FourSquare API. Because this restaurant is cannabis-themed, I also wanted to factor in the state’s status on the legalization of marijuana. To properly join these datasets, I also needed a US State to State Abbreviation dictionary.
2.2 Data Cleaning
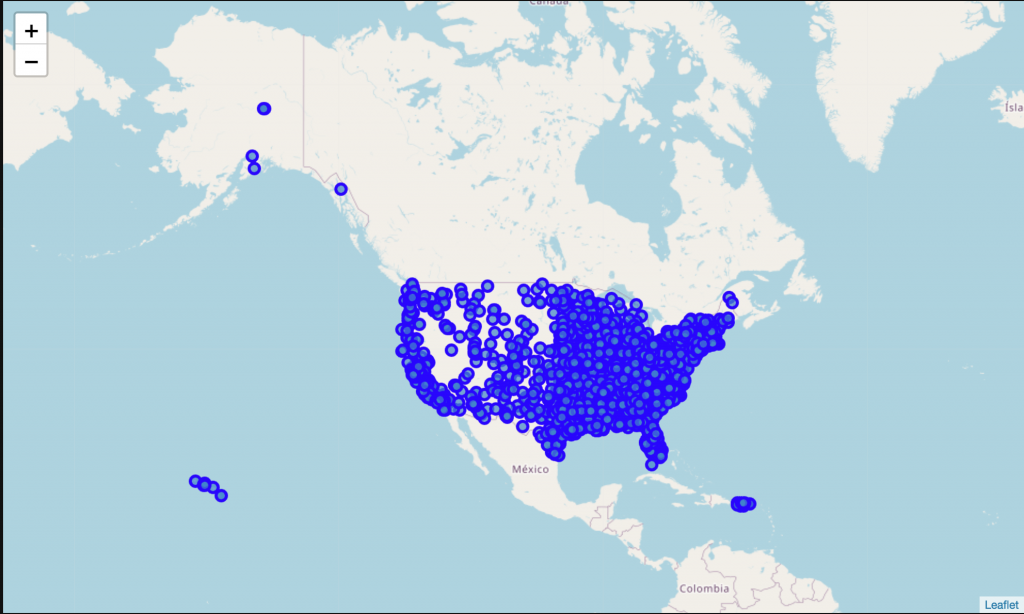
I started with the university dataset as a base to build on. The University dataset contained a field showing the total population of both students and staff which I wanted to include, as staff tends to eat where the students eat as well. There were many universities without a reported population (-999 in the dataset) so I removed those. Also, in the interest of focus, I opted to remove all universities with < 1000 student/staff totals. This gave me a starting dataset of 2,930 universities.
This data had the address of the university but did not have lat/lng information. I initially tried to use the Census Bureau’s geocoder but found that it missed many of the locations. I looked into some of those it was unable to find, pasted the address into Google Maps, and found that they were valid addresses. At this point, I realized that I had few enough locations that they would fall under the monthly free API usage for Google’s Geocoding API I used the Python Client for Google Maps Services to calculate the lat/lng for each university.
After that was complete, I plotted all universities here:
I had used the Foursquare API in previous labs for this course, so I was familiar enough to jump right in. I found the lat/lng of my current employer, Colorado State University, and looked for sandwich restaurants within 5km. After looking at the results, I realized that a lot of them were not competitive with our restaurant, as they didn’t serve alcohol. I added in a category id of ‘Bar” and the results looked more like comparable restaurants. I then ran this on every university to find the number of sandwich/bar restaurants within 3km of the university. I eventually converted this to a restaurants per student column. Also, I used the StandardScaler to standardize the university population as it was many orders of magnitude larger than the rest of the data.
The cannabis laws were a combination of true/false and categorical data, so I converted them all to one-hot values. In addition, they were associated with the full state name, so I needed to get the state abbreviation, then use that to merge with the university/foursquare dataframe.
2.3 Feature Selection
After merging, there were 2,864 rows with 20 total columns, however many of those columns were not features. There were 9 total features:
- Stores Per Person
- Legal Weed Status Fully Illegal
- Legal Weed Status Fully Legal
- Legal Weed Status Mixed
- Medicinal Weed Status False
- Medicinal Weed Status True
- Decriminalized Weed Status False
- Decriminalized Weed Status True
3. Methodology
3.1 Exploratory Data Analysis
Much of the Data Analysis was done in the process of cleaning the data. I wanted to ensure that I looked at mostly larger schools, and factored in the legality of cannabis, as well as the current number of matching restaurants per student.
3.2 Machine Learning
I opted for K-means clustering, because I was aware of locations where this restaurant had franchises, and where they were successful. I was familiar with the neighborhood classification in previous labs, and decided that after running this I would look for “neighborhoods” where stores currently existed, and, if they matched, find other neighborhoods which may make good locations for future restaurants.
4. Results
I grouped into k=5 neighborhoods, and plotted these on a map, with a different color per neighborhood.
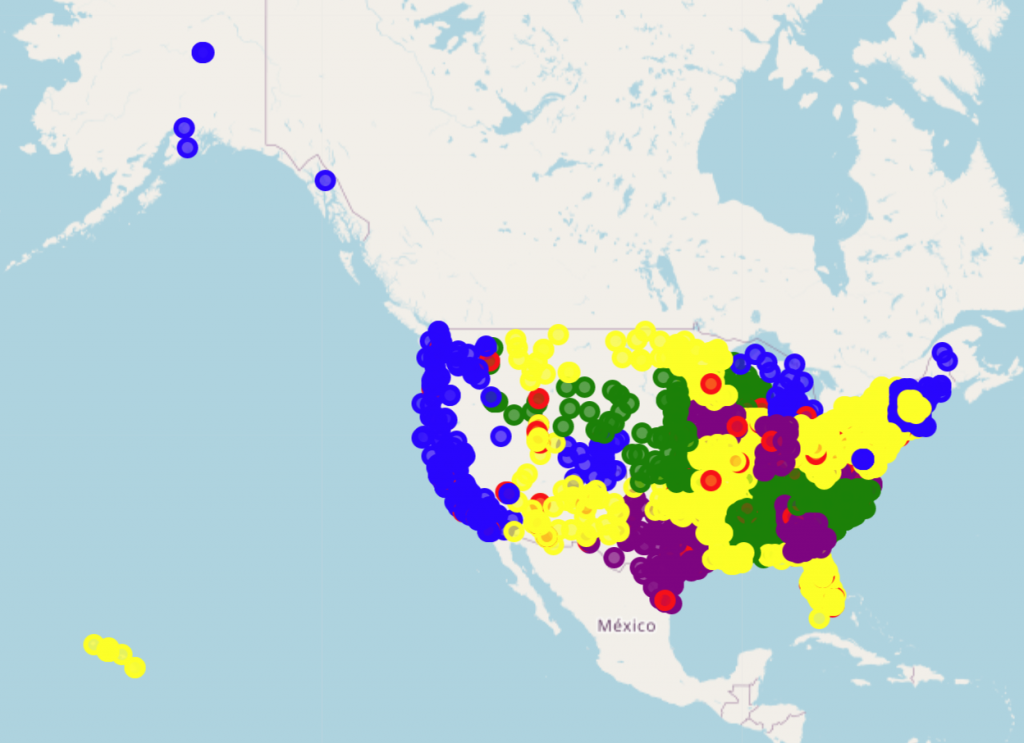
The store has successful locations in Colorado, Arizona, California, Oregon, Michigan and Texas. My initial thoughts were that the blue dots represented good locations, with Purple being secondary. These matched up with my knowledge that the west coast, Colorado and Michigan are all Recreational Cannabis legal states. Purple struck me as strong second choices, with somewhat less lax laws.
I decided to explore some locations which I knew were successful:
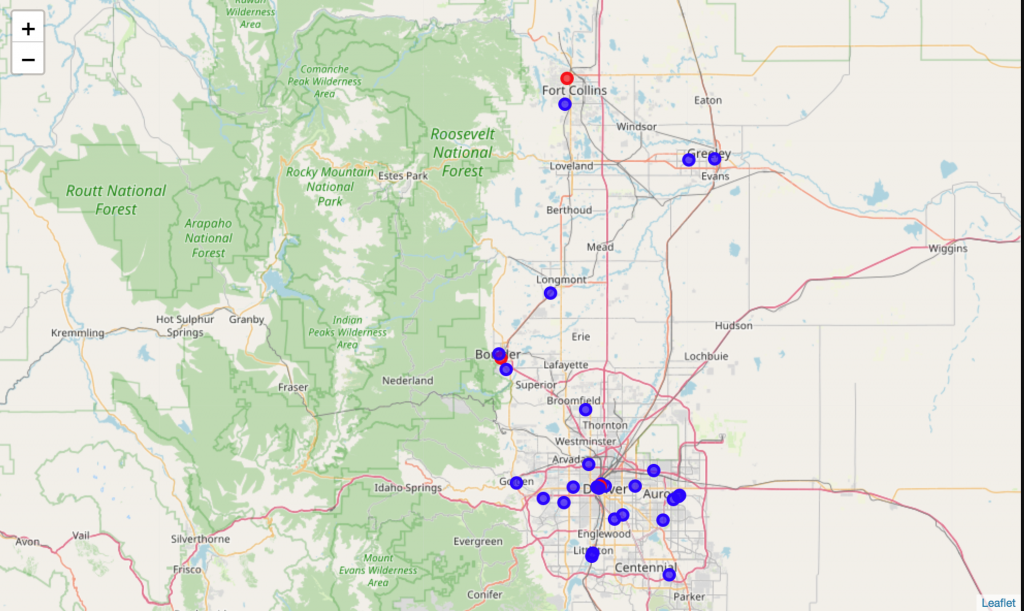
This map of the Colorado Front Range shows many blue colleges, but also three red. The three red were CSU – Fort Collins, CU – Boulder, and UC Denver. These happened to coincide with restaurant locations, so I looked around and found more red dots over existing locations.
I decided to map just Label=3 dots:
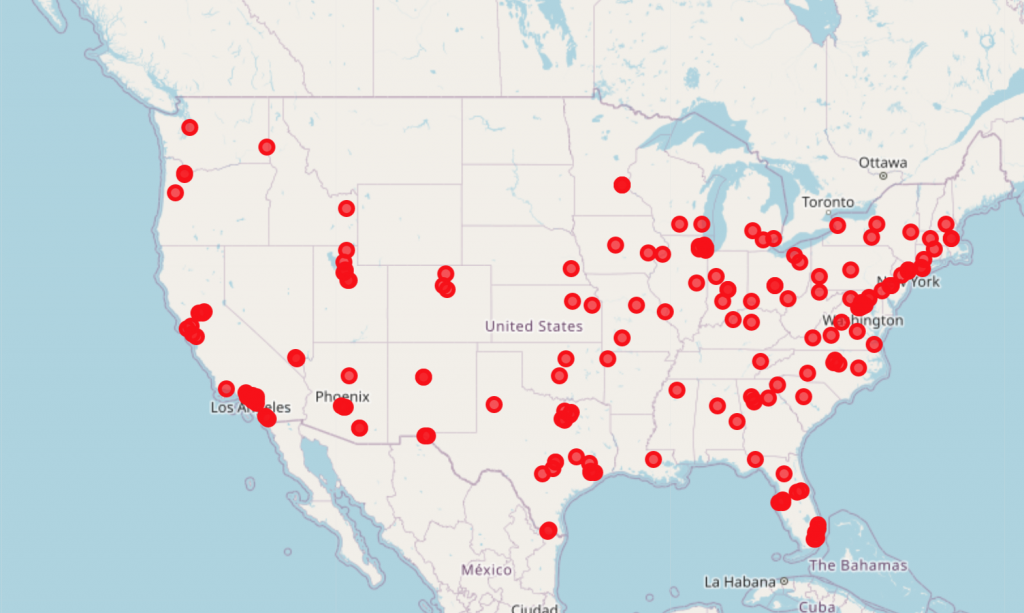
I found these interesting enough to drill down into. I described these data to find out the following:
- Mean population: 43,333
- Mean Sandwich store Count: 153
- Mean Stores per person: 0.0039
- 50% value of Mixed and Medicinal legality was True
5. Discussion
There seems to be three potential predictors for a good location. College size, Existing Restaurant density, and the laxity of the state marijuana laws.
The mean size of all colleges was 8,208, whereas the mean of the “3” cluster was 43,333. This would contribute both to an increase of potential customers for food, as well as lowering the Stores Per Person.
The mean existing restaurant density (Stores Per Person) for all colleges was 0.026, whereas for the “3” cluster it was a much lower 0.0039. This would provide another datapoint to filter on to find potential restaurant locations. Finding a very low ratio would indicate a potential desire for more restaurants.
I expected the cannabis legality laws to have more of an impact, but it appears that Medicinal Marijuana legality was the main predictor for the “3” cluster.
6. Conclusion
Future work could be done on this problem to further narrow down locations. I would want to fine-tune the three parameters to narrow down the potential universities even further.
Without further fine-tuning though, it becomes clear that targeting large universities in medical marijuana legal states, preferably without a lot of pre-existing restaurant locations would be the best predictor of success for this franchise.